This package includes functions to query the Article Search API of The New York Times for articles with an “India” location keyword. It also includes functions to prepare this data to be ready for analysis, as well as a shiny app to visualize the output dataset.
Installation
The impetus to restructure what was originally a data analysis project as a package was:
- to simplify updating the dataset over time
- to learn how to make a package.
Accordingly, this is mostly a personal package, but it can be installed from GitHub:
install.packages("devtools")
devtools::install_github("seanangio/nytindia")
Query Data
To query all articles with an India location keyword from the NYT Article Search API between two dates, run the following in the top level folder of a new RStudio project.
library(nytindia)
nyt_get_data(begin_date = "YYYY-MM-DD",
             end_date = "YYYY-MM-DD")
You’ll need environmental variables called “NYTIMES_KEY” and “NYT_USER_AGENT”.
If the directory is empty, leaving begin_date empty will default to 1851 (the earliest available date). Otherwise, it will begin from the last date found. Leaving end_date empty will default to the current date.
It queries up to the closest completed month.
The query searches for all articles with an “India” location keyword. You should be able to change the default query with the parameters “q” and “fq”. See the reference documentation here.
Prepare Data
Once you have your data from the API, there is a pipeline of functions available to prepare the data. You can run the following to create the prepared dataset.
This should successfully output a dataset in a folder called nyt_shiny_app, but there are a number of manual steps that should ideally be included – as explained in the reference documentation and the Technical Details vignette.
- renaming news desks
- renaming keyword values
- renaming categories of keywords
- geocoding locations
These are optional, but without them:
- the map will be empty,
- the keywords and news desk categories may be overlapping depending on the expanse of time you are querying,
- the keyword heatmap may be broken.
That’s why nyt_build_data() is especially useful when just updating a dataset with a new month, when the lookup tables and geocoding has already been done.
To build the dataset step by step, use the following script. This is essentially what nyt_build_data() is doing.
# 01-query-nyt-api.R
api_df <- nyt_bind_api_files()

# 02-prepare-nested.R
combined_df <- nyt_clean_api_tbl(api_df)

# 03-clean-news-desks.R
nested_df <- nyt_clean_news_desks(combined_df)

# 04-unnest-df.R
unnested_df <- nyt_unnest_df(nested_df)

# 05-clean-keywords.R
consolidated_unnested_df <- nyt_clean_keywords(unnested_df)

# 06-fix-keywords.R
unnested_df_values_fixed <- nyt_fix_keywords(consolidated_unnested_df)

# 07-query-mapquest.R
nyt_query_mapquest_api(unnested_df_values_fixed)

# 08-add-coords-countries.R
full_unnested_df <- nyt_join_coords_countries(unnested_df_values_fixed)

# 09-re-nest-keywords.R
full_nested_df <- nyt_re_nest_keywords(full_unnested_df)

# 10-write-final-nested-df.R
nyt_write_final_nested_df(full_nested_df)

# 11-download-shiny-files.R
nyt_download_shiny_files()
Run the Shiny App
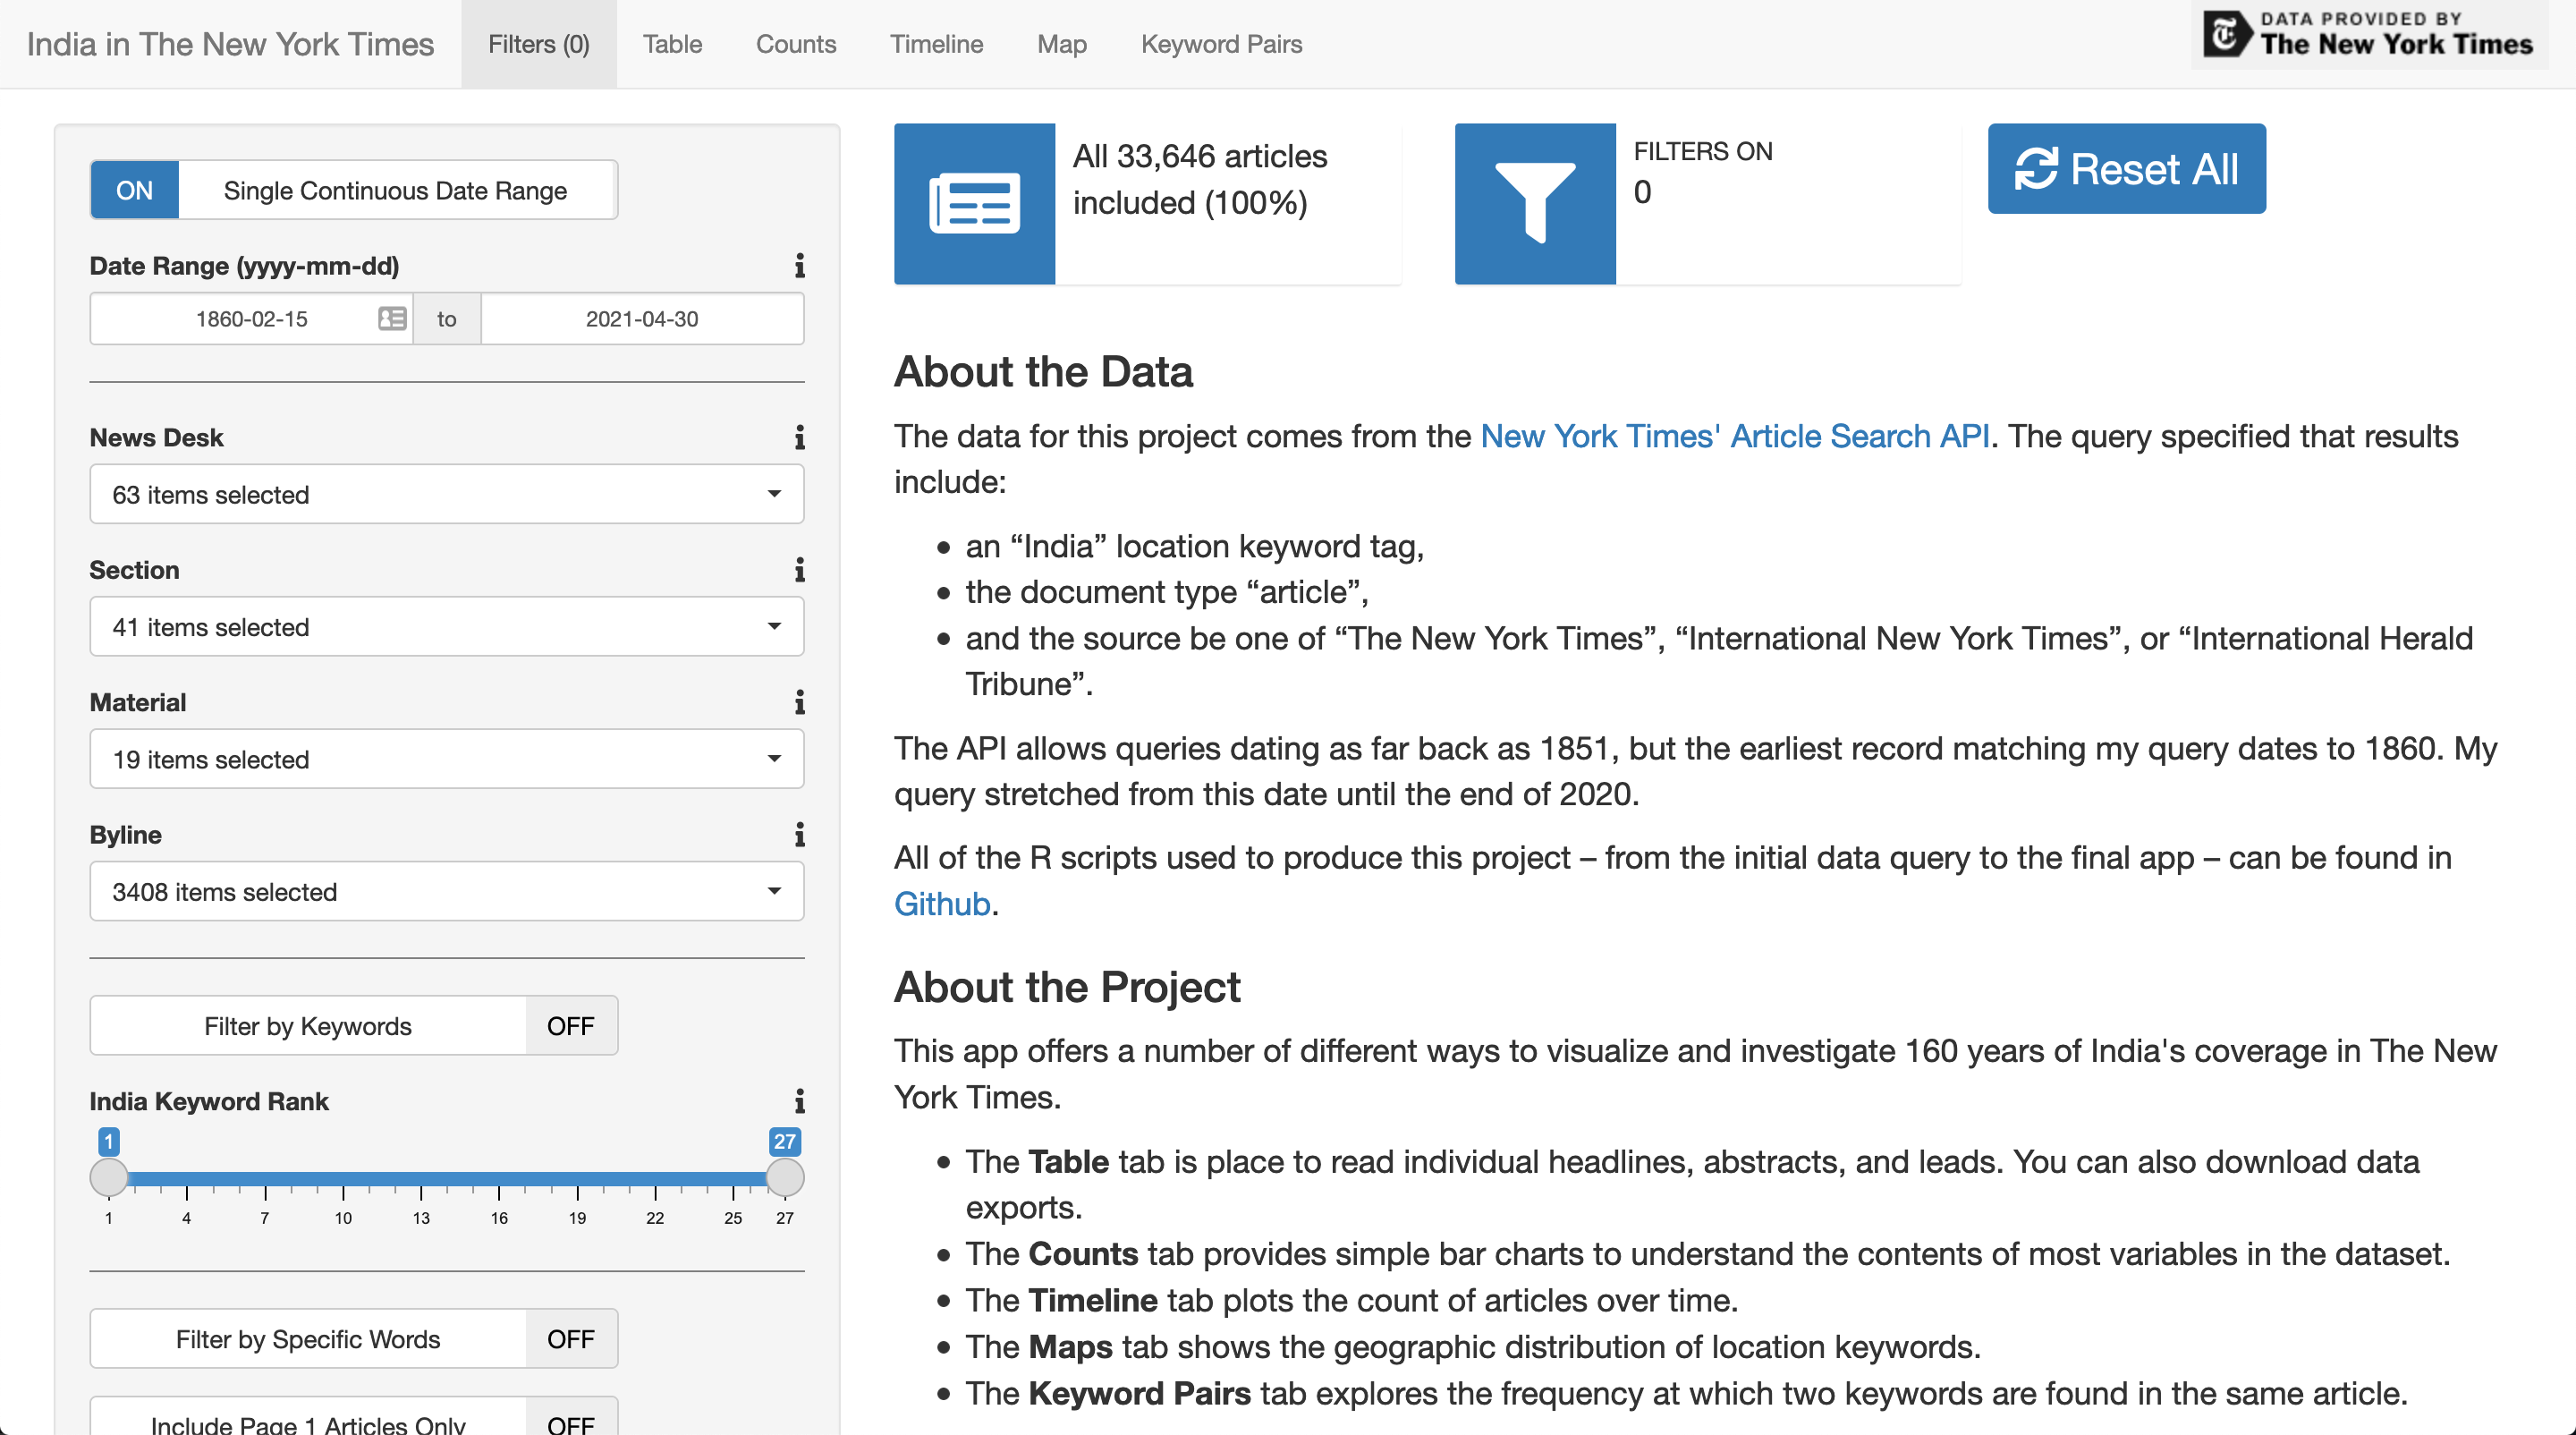
The package includes a shiny app to visualize the results in many different ways.
To run it locally, you’ll need the following packages included in the “Suggests” section of this package’s DESCRIPTION file.
shiny_pkgs <- c("shiny","markdown","ggplot2","forcats","scales",
                "shinyWidgets","bsplus","shinycssloaders","DT",
                "ggiraph","tidytext","tsbox","dygraphs","gt",
                "leaflet","leaflet.extras","shinydashboard",
                "waiter")

install.packages(shiny_pkgs)

nyt_run_example("nyt_india_app")
Analysis
You can find package vignettes analyzing the data and summarizing the technical details.